Sojuva

The work, the evidence and what changed.

These stories show the starting point, the work completed and the result alongside the original Search Console, SEMrush or AI Overview evidence. Where progress is still underway, we say so.

CircleDNA

Organic traffic 50K → 150K sessions per month

Source: SEMrush · 6-month engagement

Starting point
The site started at 50,000 organic sessions a month, with one of ten target keywords in the top ten.
What changed
The programme introduced citation tracking and a schema audit, then shipped FAQ and product schema alongside answer-first rewrites for key pages.
Result
After six months, traffic reached 150,000 monthly sessions and seven of ten target keywords ranked on page one.

The chart illustrates the delivery shape; the six-month traffic outcome is the confirmed result.
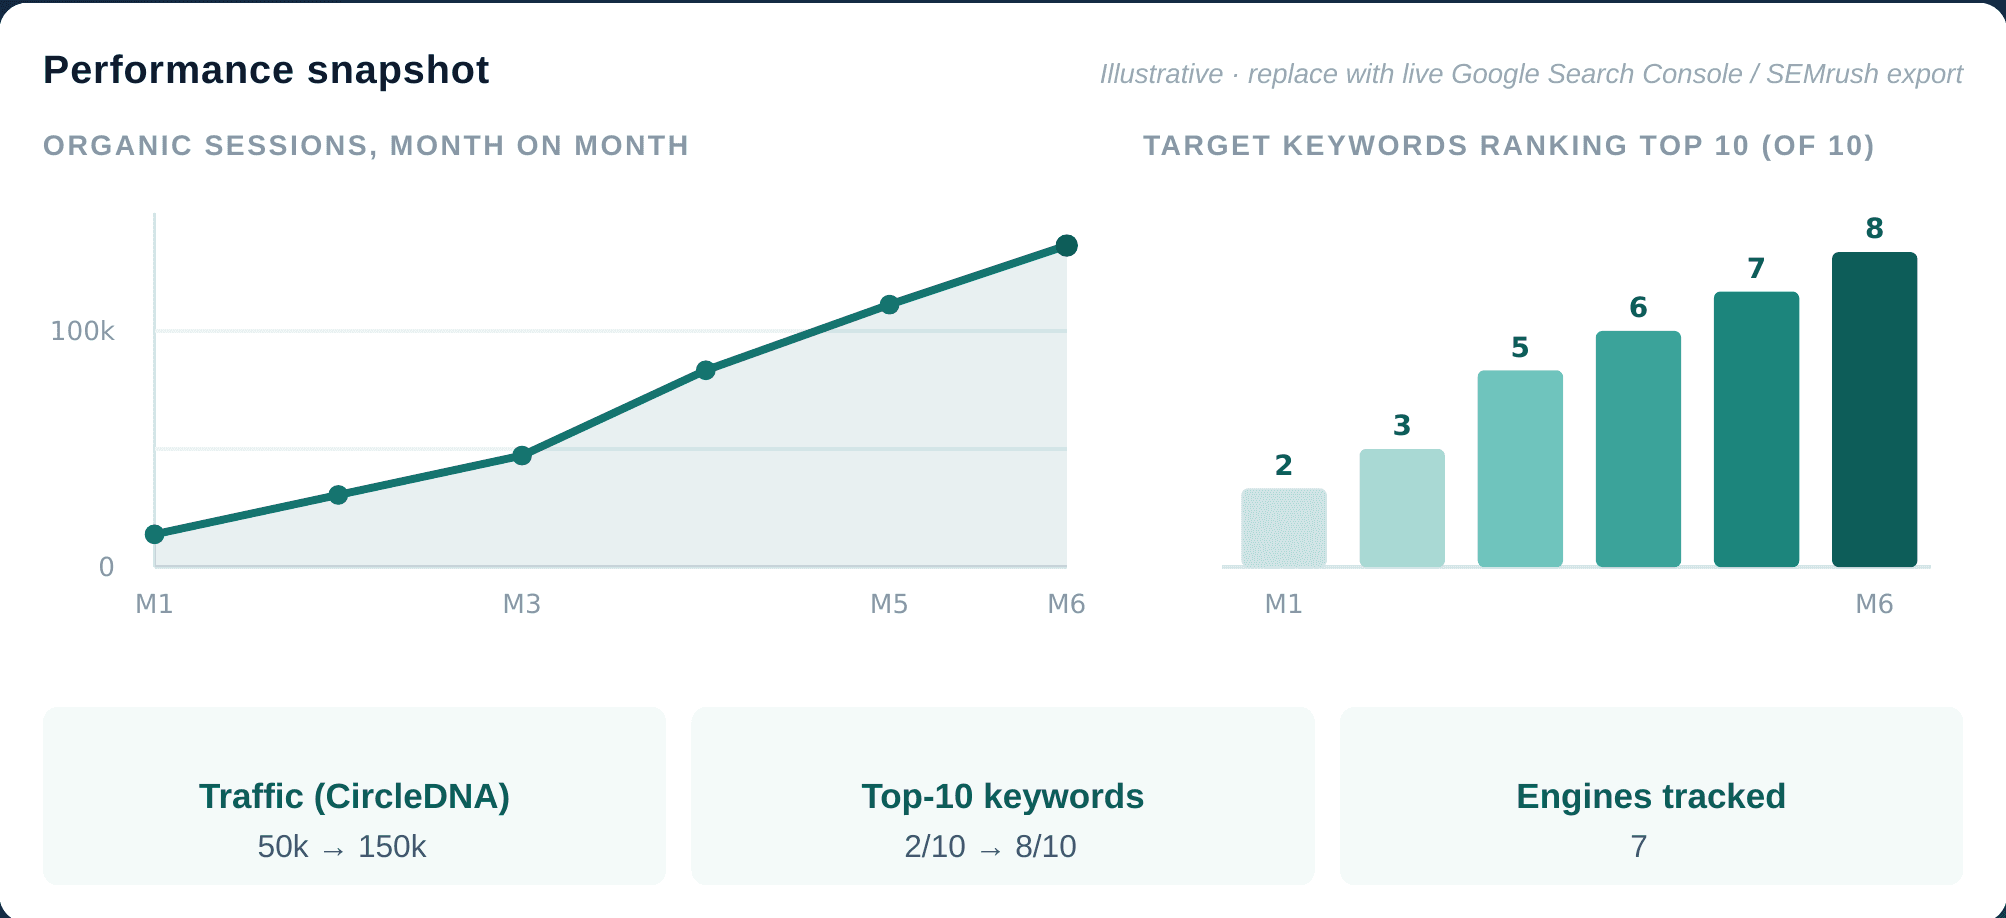
CircleDNA performance snapshot showing organic sessions and target keyword visibility over six months.
Performance snapshot

Mil Design

Search impressions up 195%, with new non-brand visibility

Source: Google Search Console · Ongoing since March 2025

Starting point
The account began with a compact search footprint: 1.73K impressions, 78 clicks and visibility largely concentrated on branded searches.
What changed
Continuous on-page and content optimisation expanded coverage from brand terms into the non-brand interior-design category.
Result
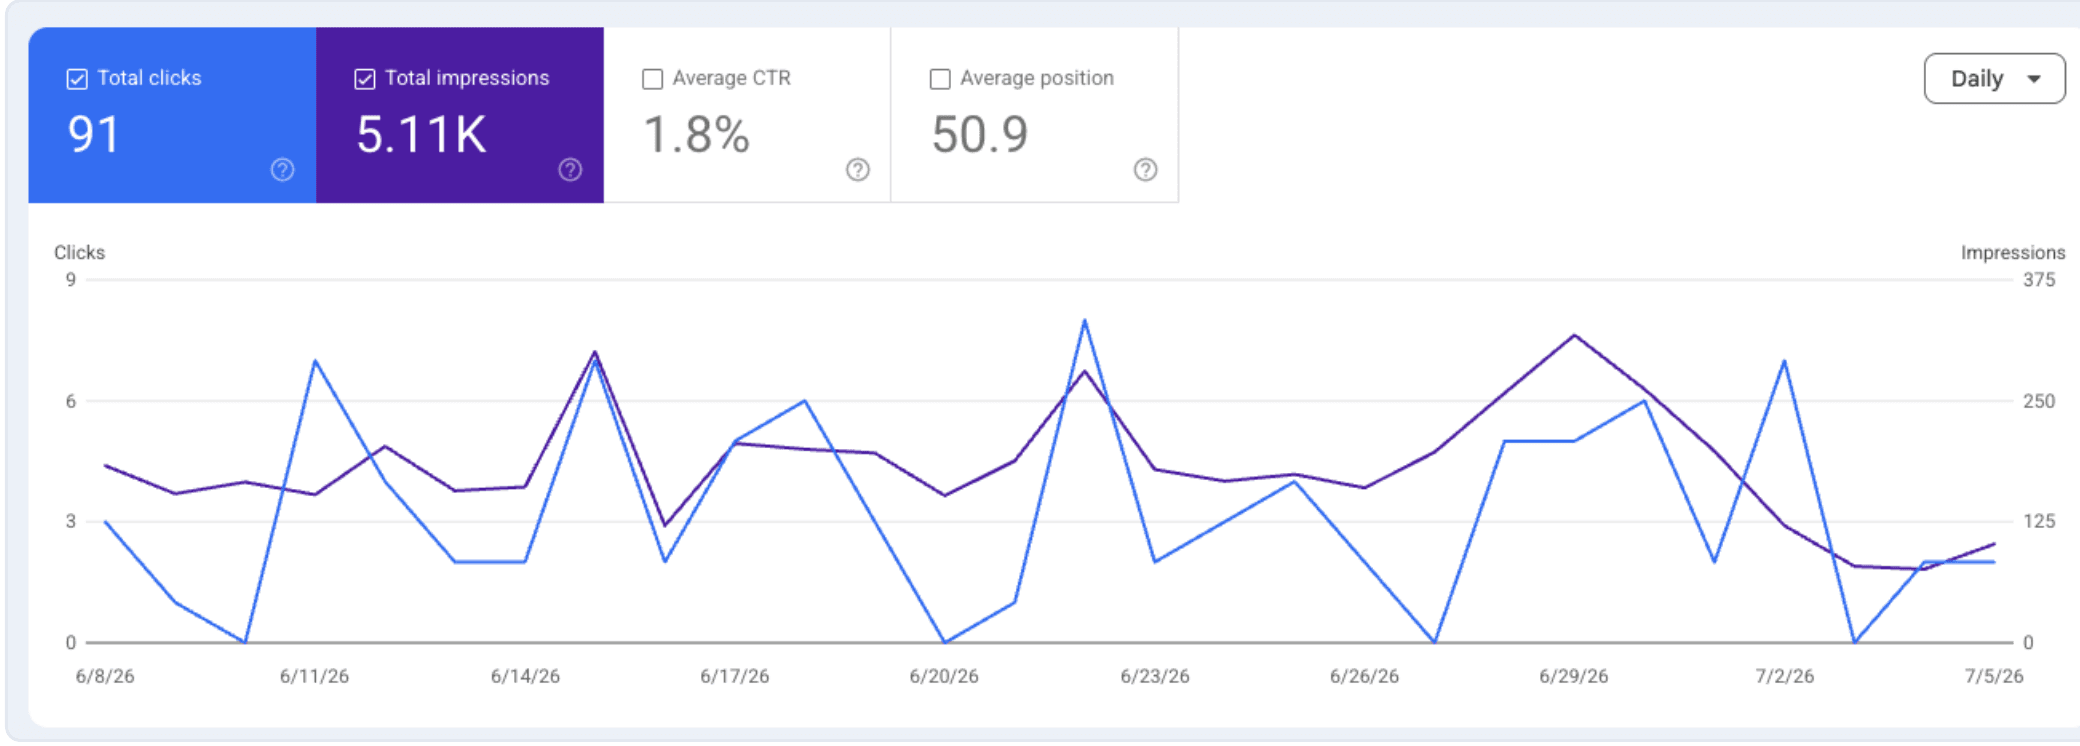
Impressions increased to 5.11K and the account began appearing for broader category queries such as interior design Malaysia.

The broader keyword set is still maturing, so CTR and average position are shown as in-progress rather than as a finished win.

Mil Design Google Search Console dashboard with 91 clicks and 5.11K impressions.
Current Search Console view
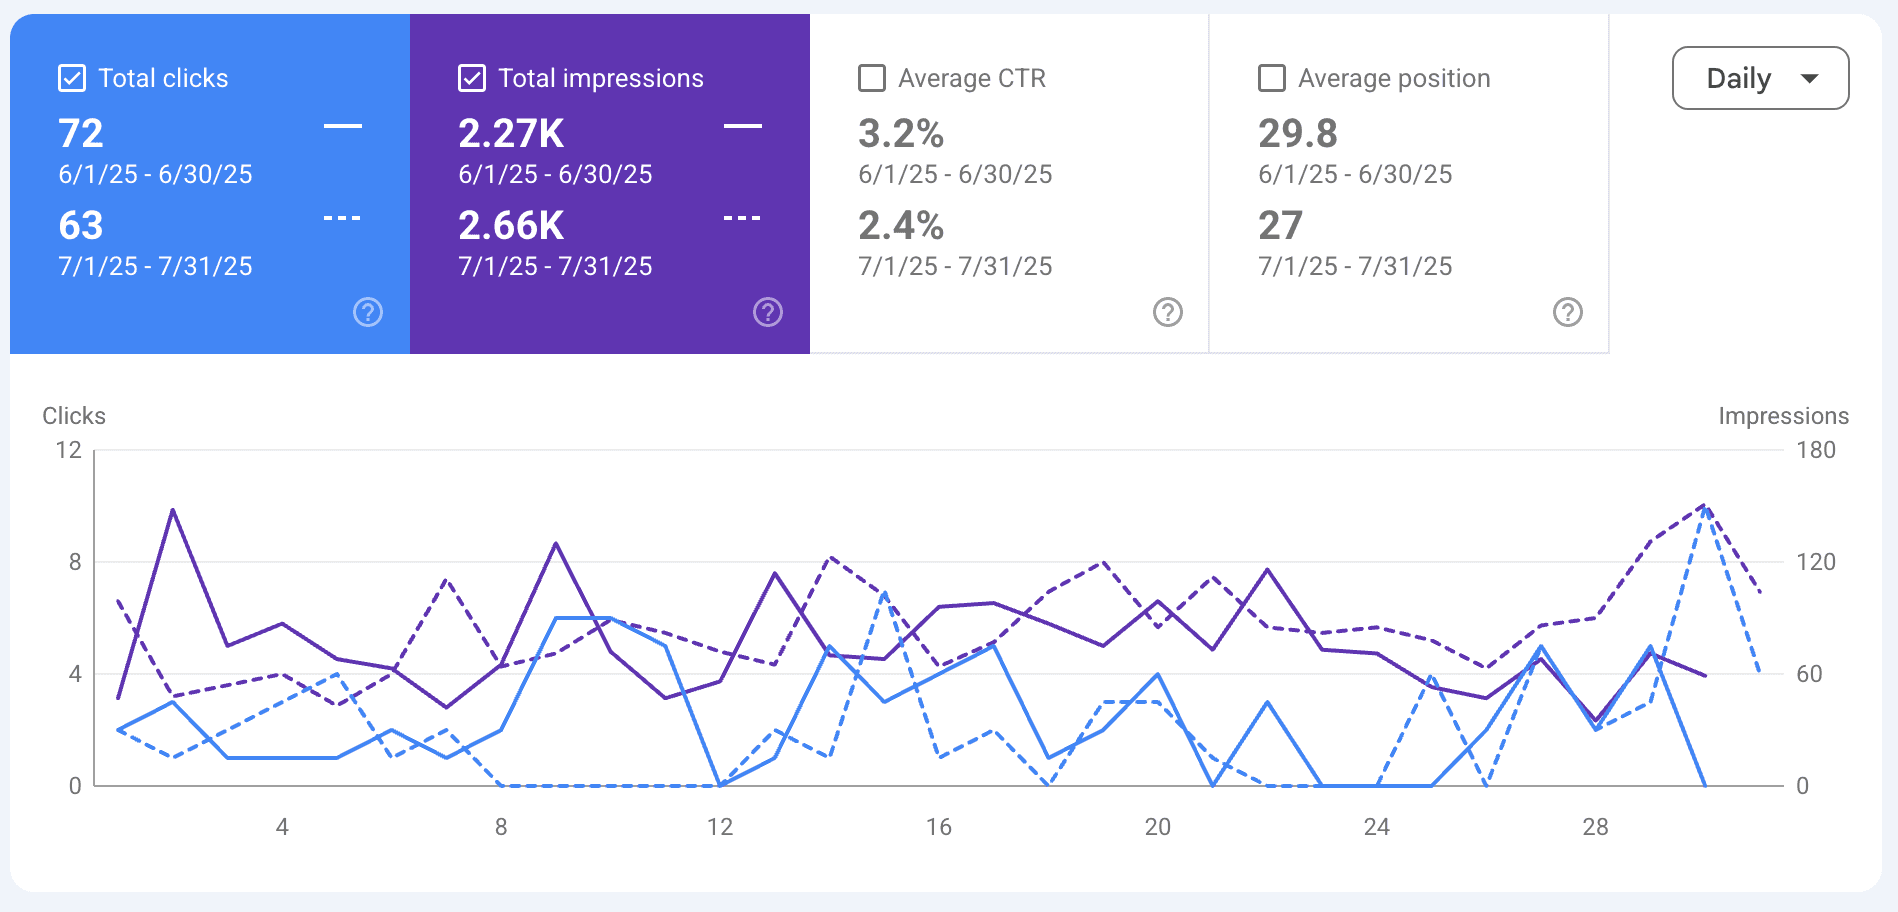
Mil Design Search Console comparison for June and July 2025.
Monthly comparison

TigerCampus

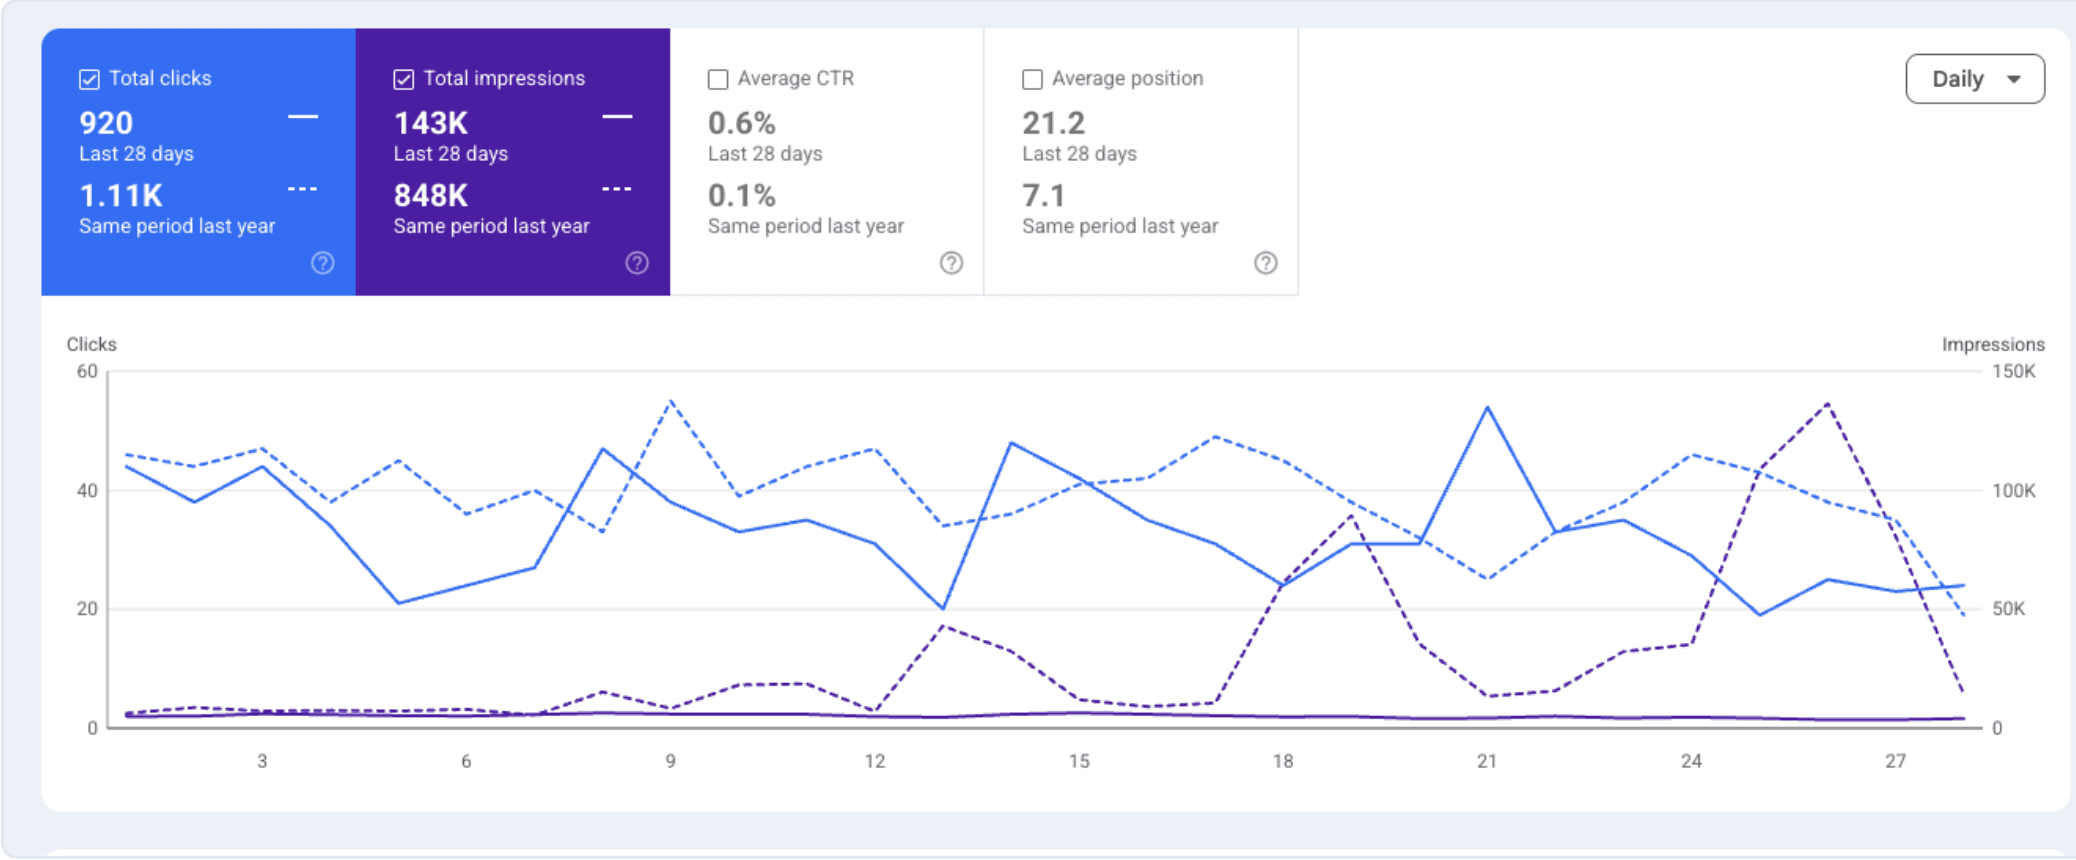
848K impressions during active SEO; visibility fell 83% after the work paused

Source: Google Search Console · Same 28-day period, year over year

Starting point
During active work, the account recorded 848K impressions, 1.11K clicks and an average position of 7.1.
What changed
The engagement was paused, creating a direct before-and-after view of what happened to search visibility without continuous optimisation.
Result
In the comparable window after the pause, impressions declined to 143K and average position moved from 7.1 to 21.2.
TigerCampus Google Search Console year-over-year comparison showing 920 clicks and 143K impressions versus 1.11K clicks and 848K impressions.
Same 28-day period, year over year
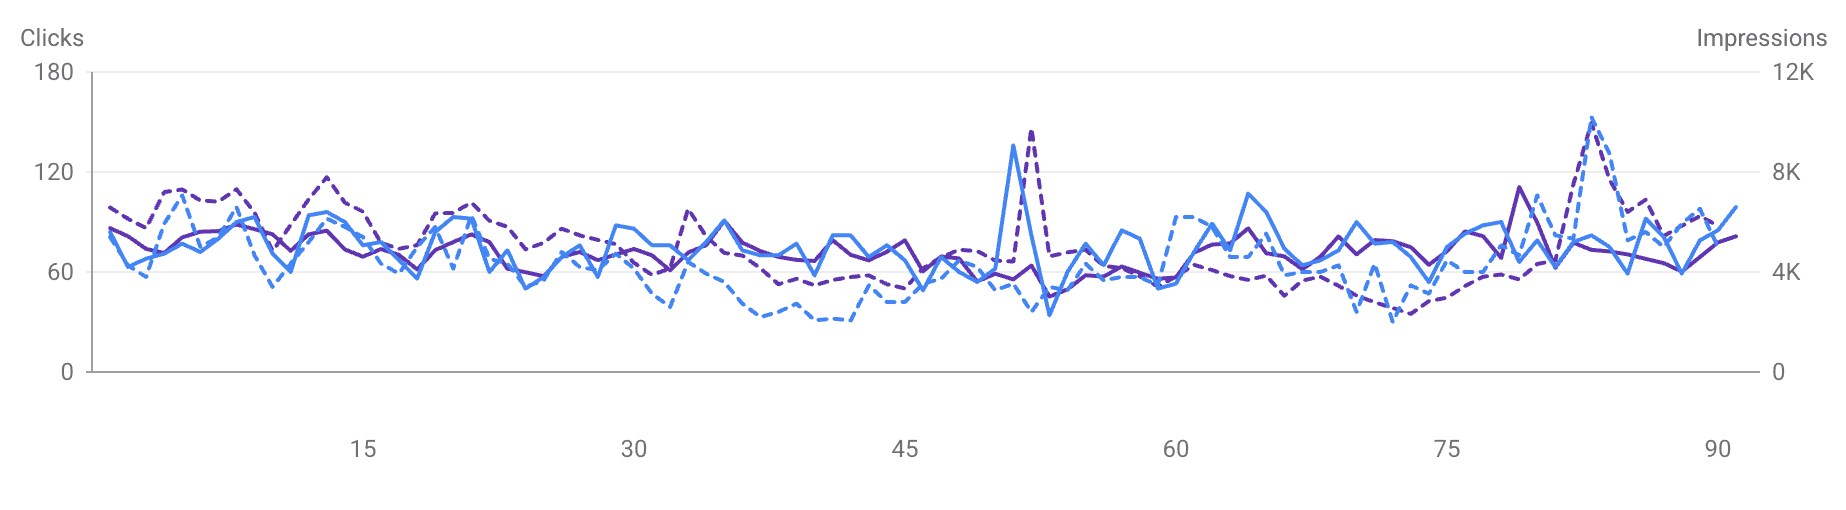
TigerCampus Google Search Console 90-day clicks and impressions tracking view.
90-day tracking view

MonstarX

Clicks up 24%, impressions up 51%, and cited in AI comparisons

Source: Google Search Console and Google AI Overviews · Last 3 months vs. previous 3 months

Starting point
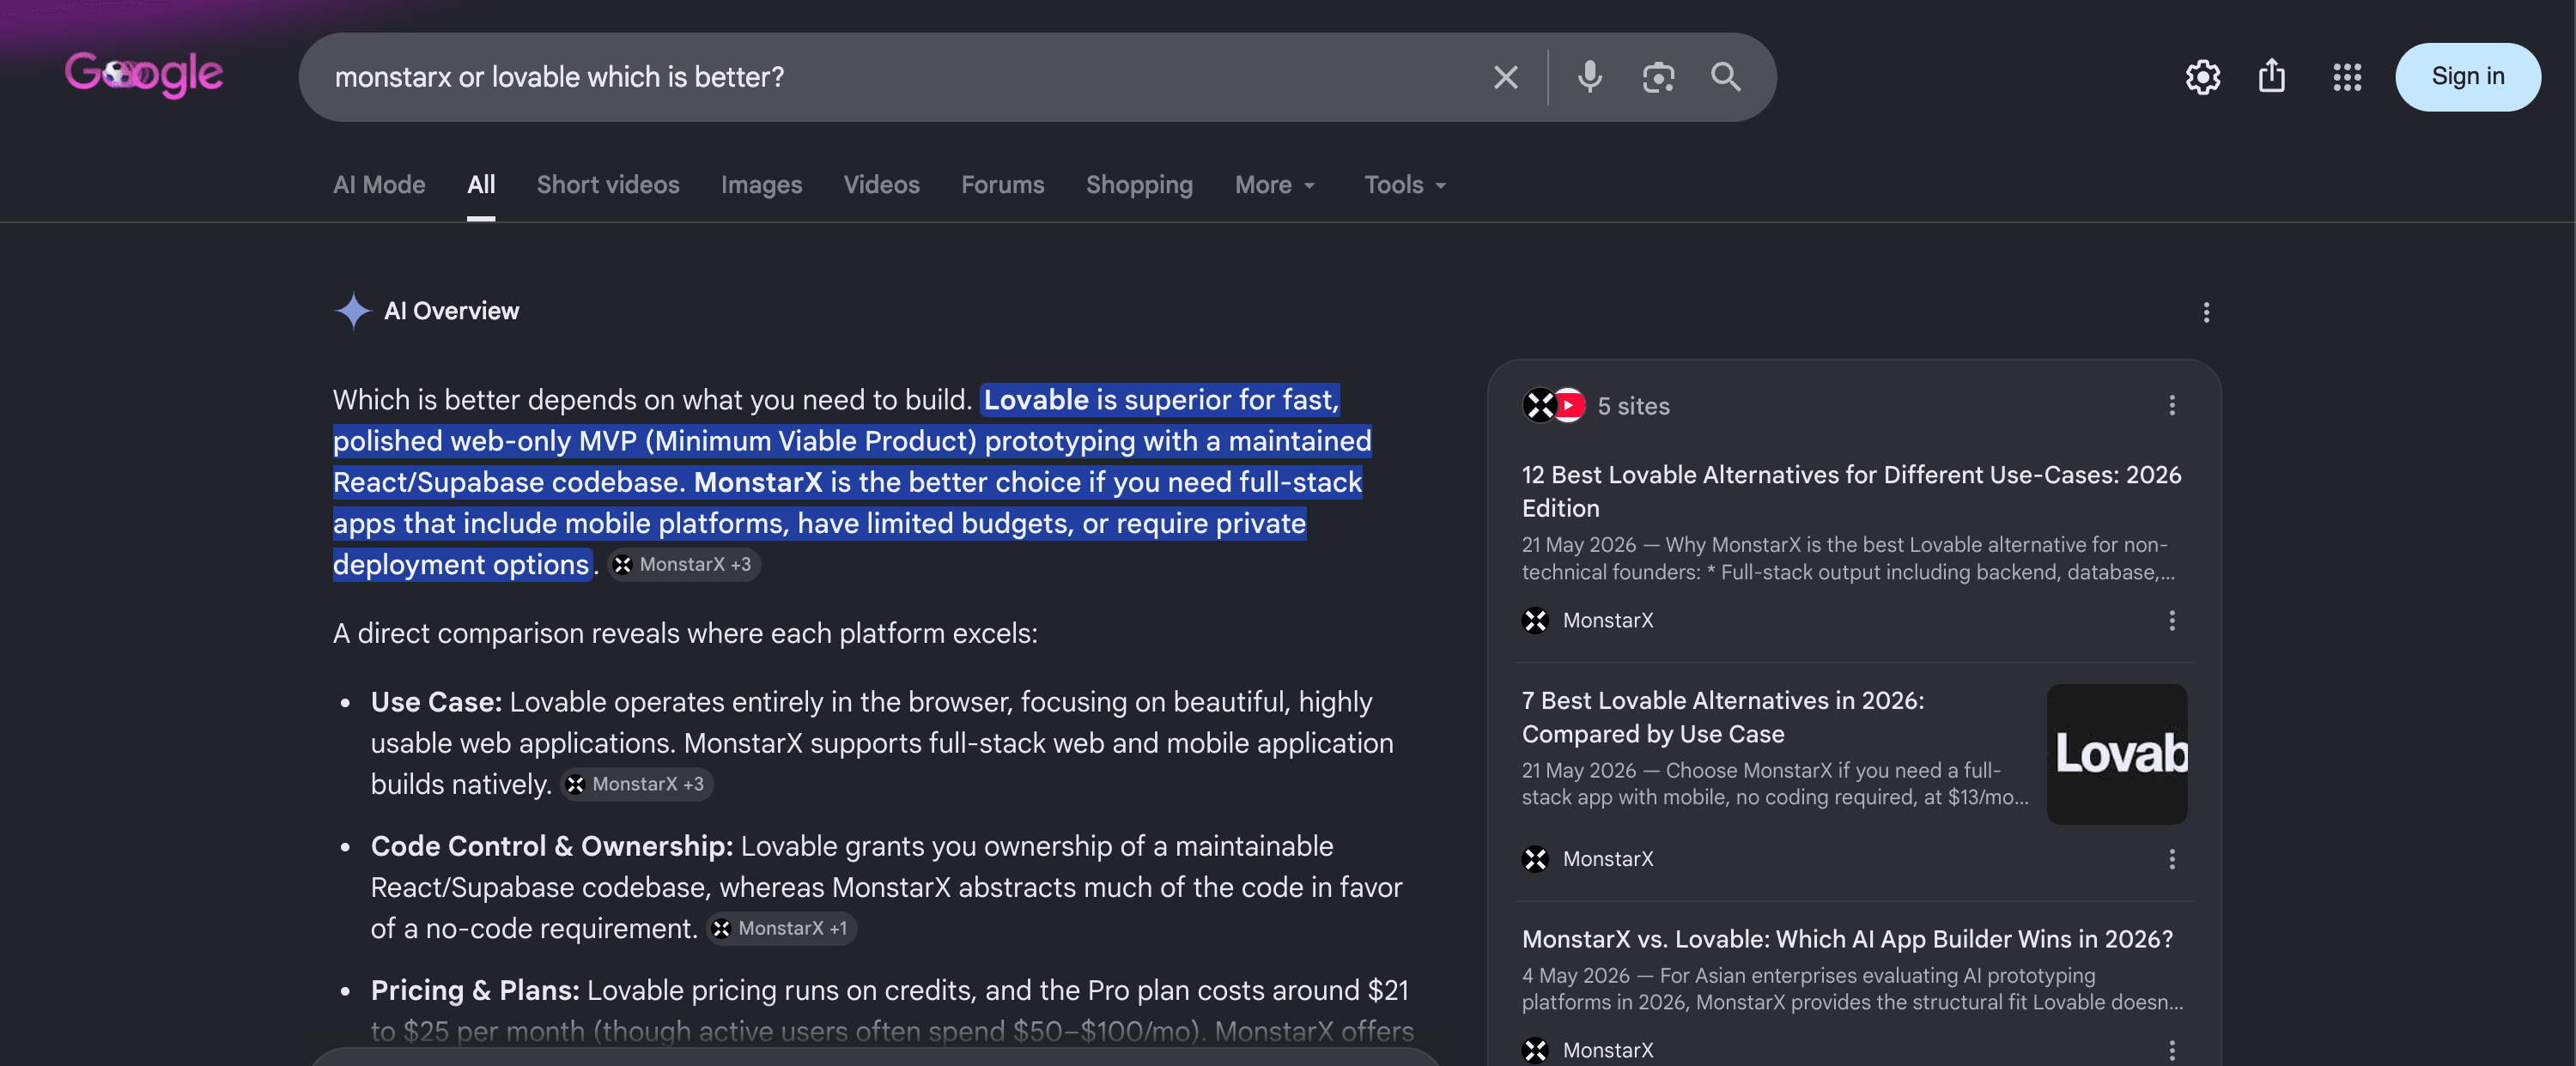
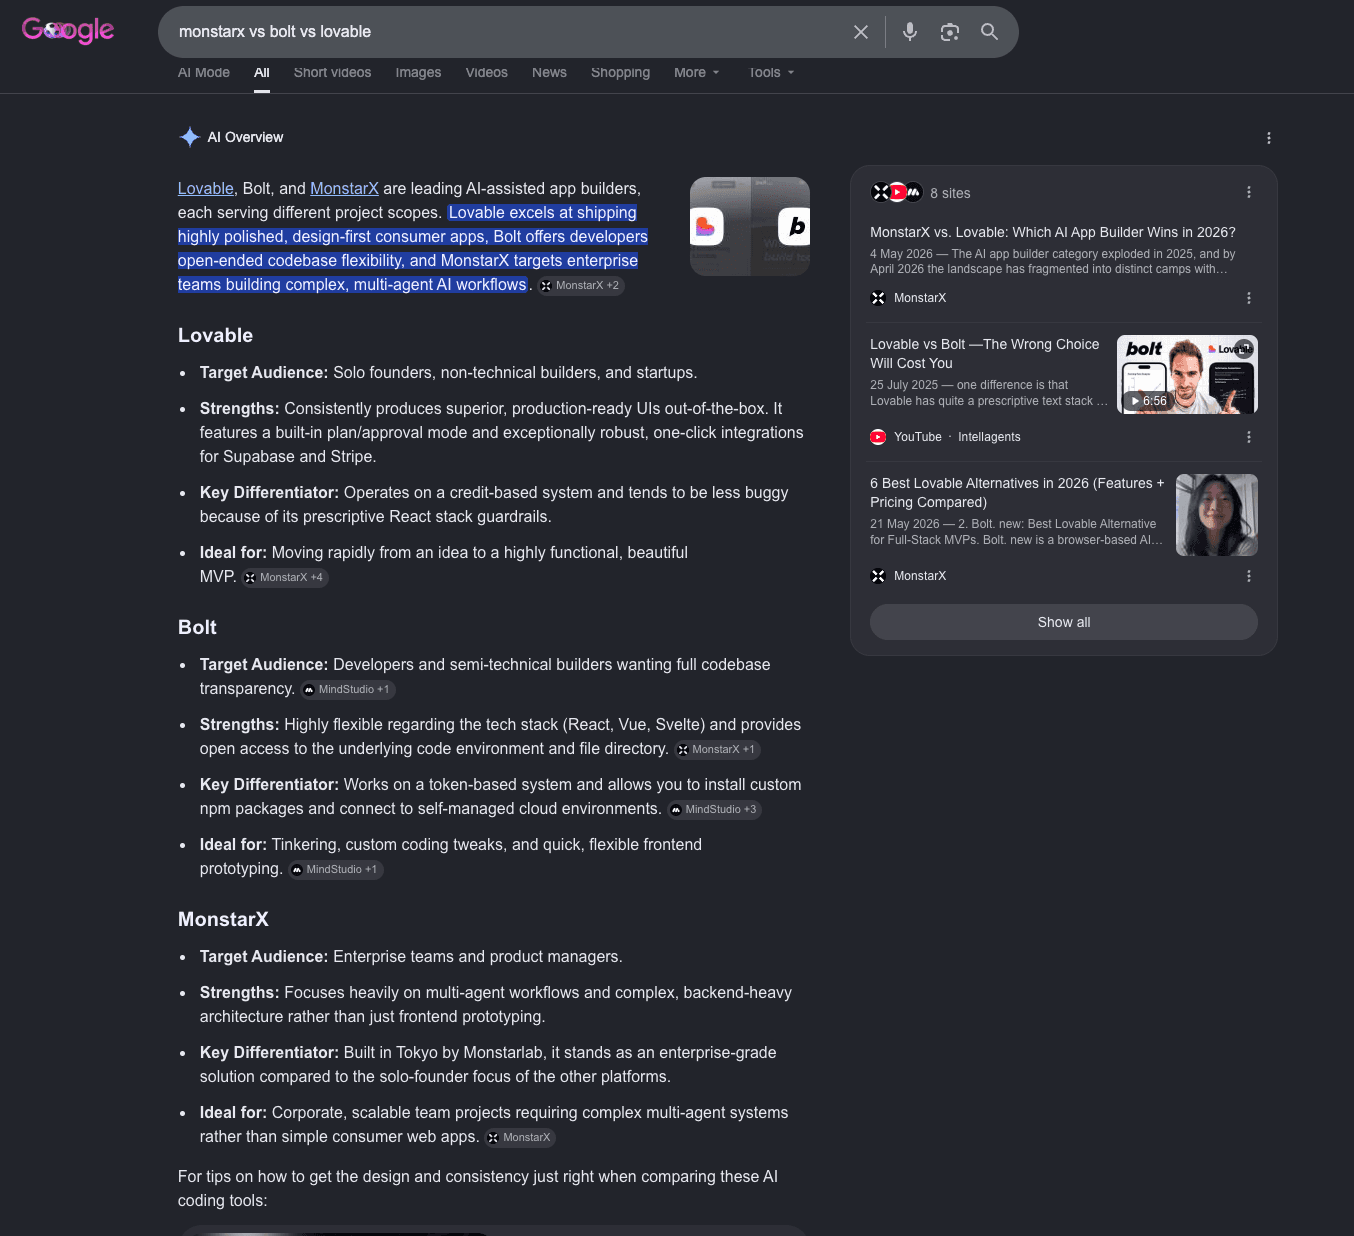
MonstarX had steady page-one visibility but was rarely present in AI-generated answers when buyers compared it with alternatives.
What changed
The engagement automated the publishing pipeline, rebuilt the landing-page structure and focused the content on buyer sign-ups and comparison intent.
Result
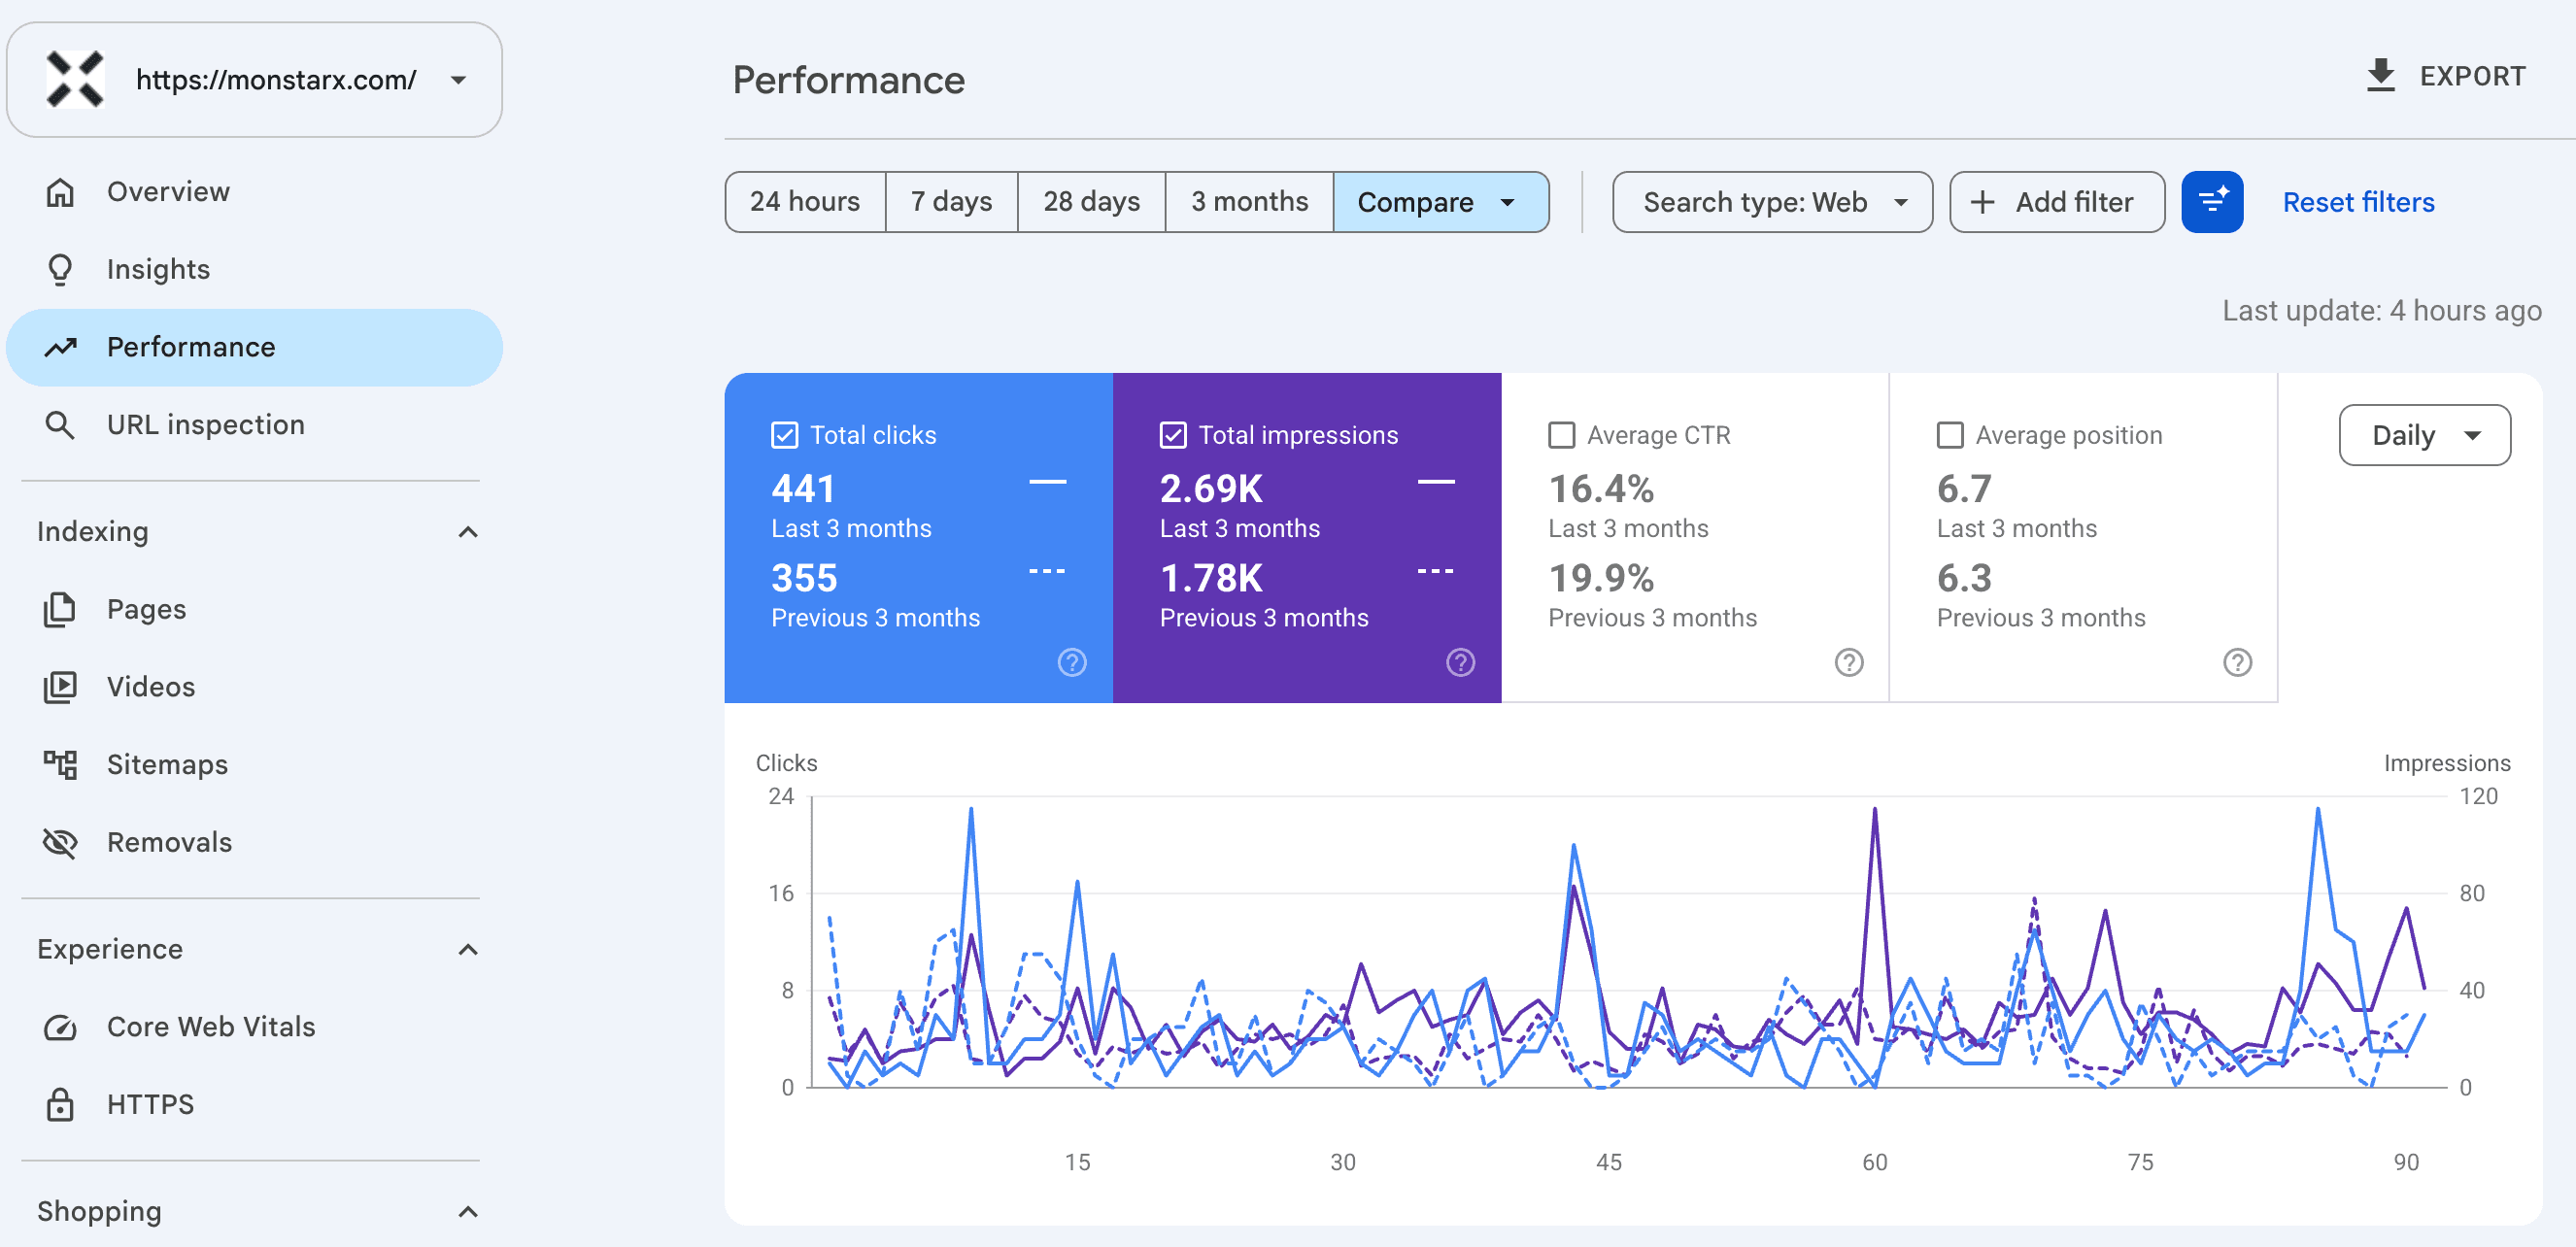
Clicks increased from 355 to 441 and impressions from 1.78K to 2.69K. The brand also appeared by name in AI Overview comparison answers.
MonstarX Google Search Console dashboard showing 441 clicks and 2.69K impressions in the last three months.
Search Console: last 3 months vs. previous 3 months
Google AI Overview for a MonstarX versus Lovable comparison.
AI Overview comparison result
Google AI Overview that includes a dedicated MonstarX section in a comparison with Bolt and Lovable.
AI Overview comparison result
MonstarX blog showing the automated publishing pipeline in production.
Live publishing workflow

Darlie

Traffic up 55% in three months after a technical reset

Source: SEMrush and Google Search Console · 2020–2022 engagement, with current tracking

Starting point
The site began at roughly 6.2K monthly visits while Core Web Vitals and mobile page experience were becoming important ranking signals.
What changed
The foundation work covered Core Web Vitals, mobile optimisation, indexation cleanup and brand-term coverage.
Result
Monthly visits reached 9.6K by May, up 55% from March. Current tracking continues to show gains in clicks, impressions and average position.
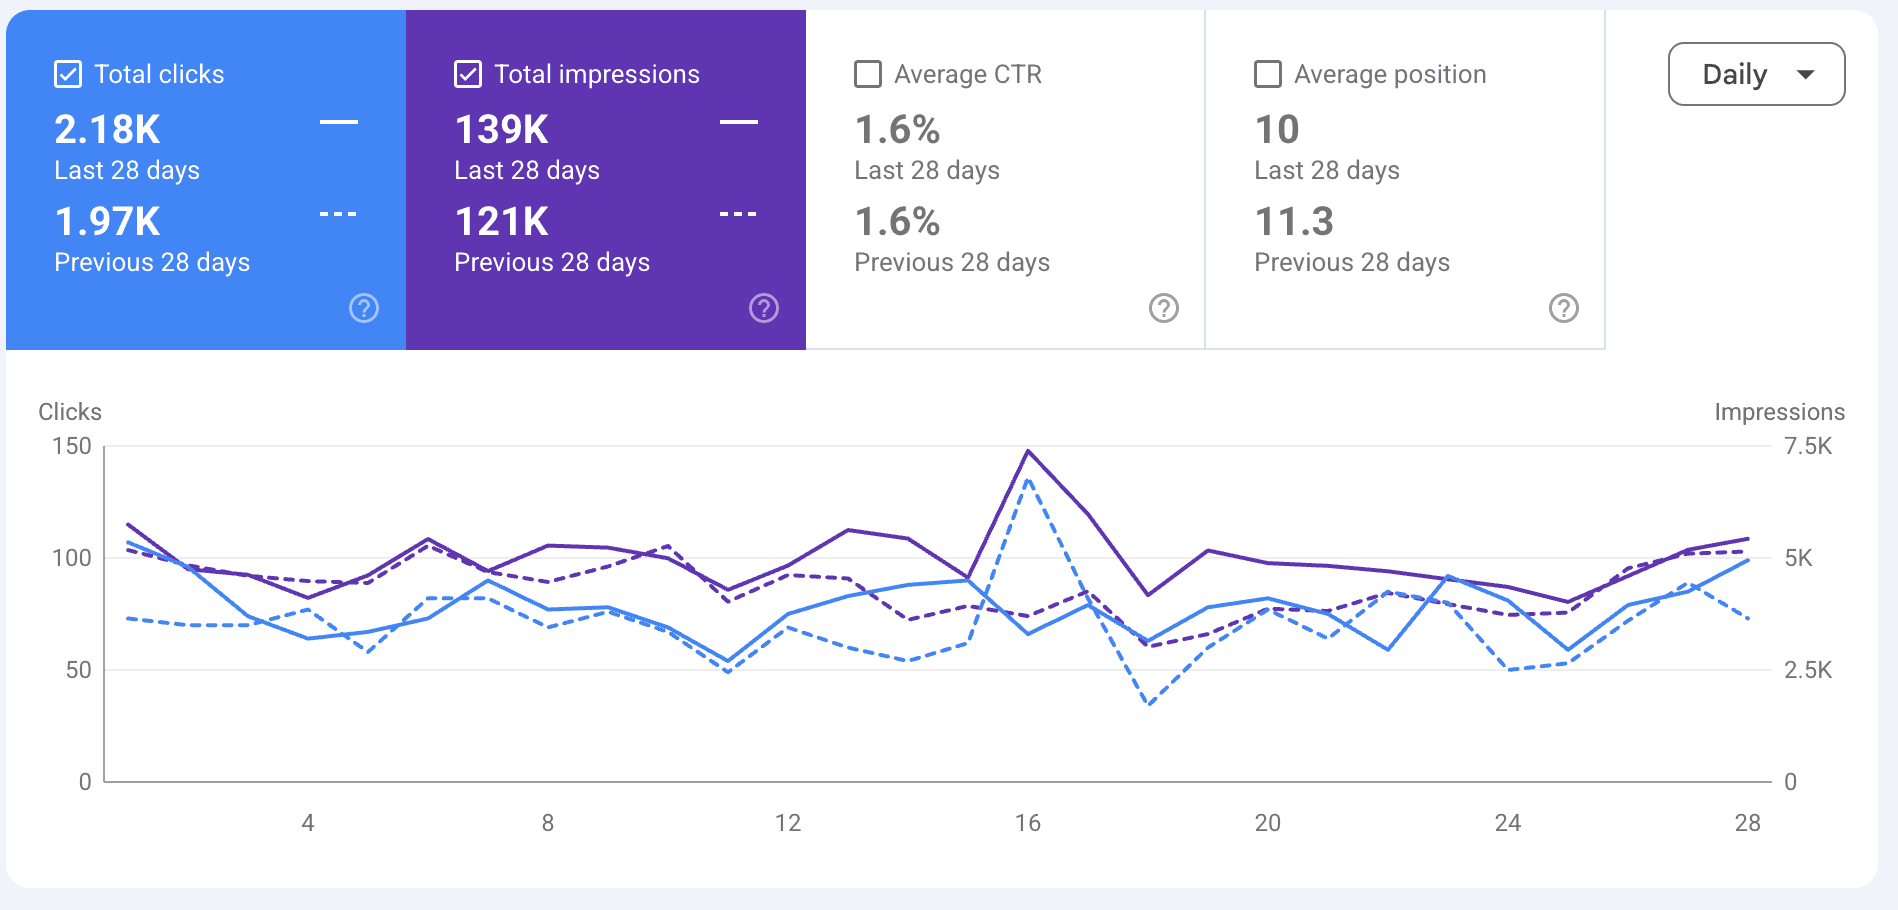
Darlie Google Search Console dashboard with current 28-day clicks, impressions and average-position comparison.
Current 28-day tracking

Live accounts, shown as they are.

These Search Console snapshots show current movement for accounts without a full process narrative yet.

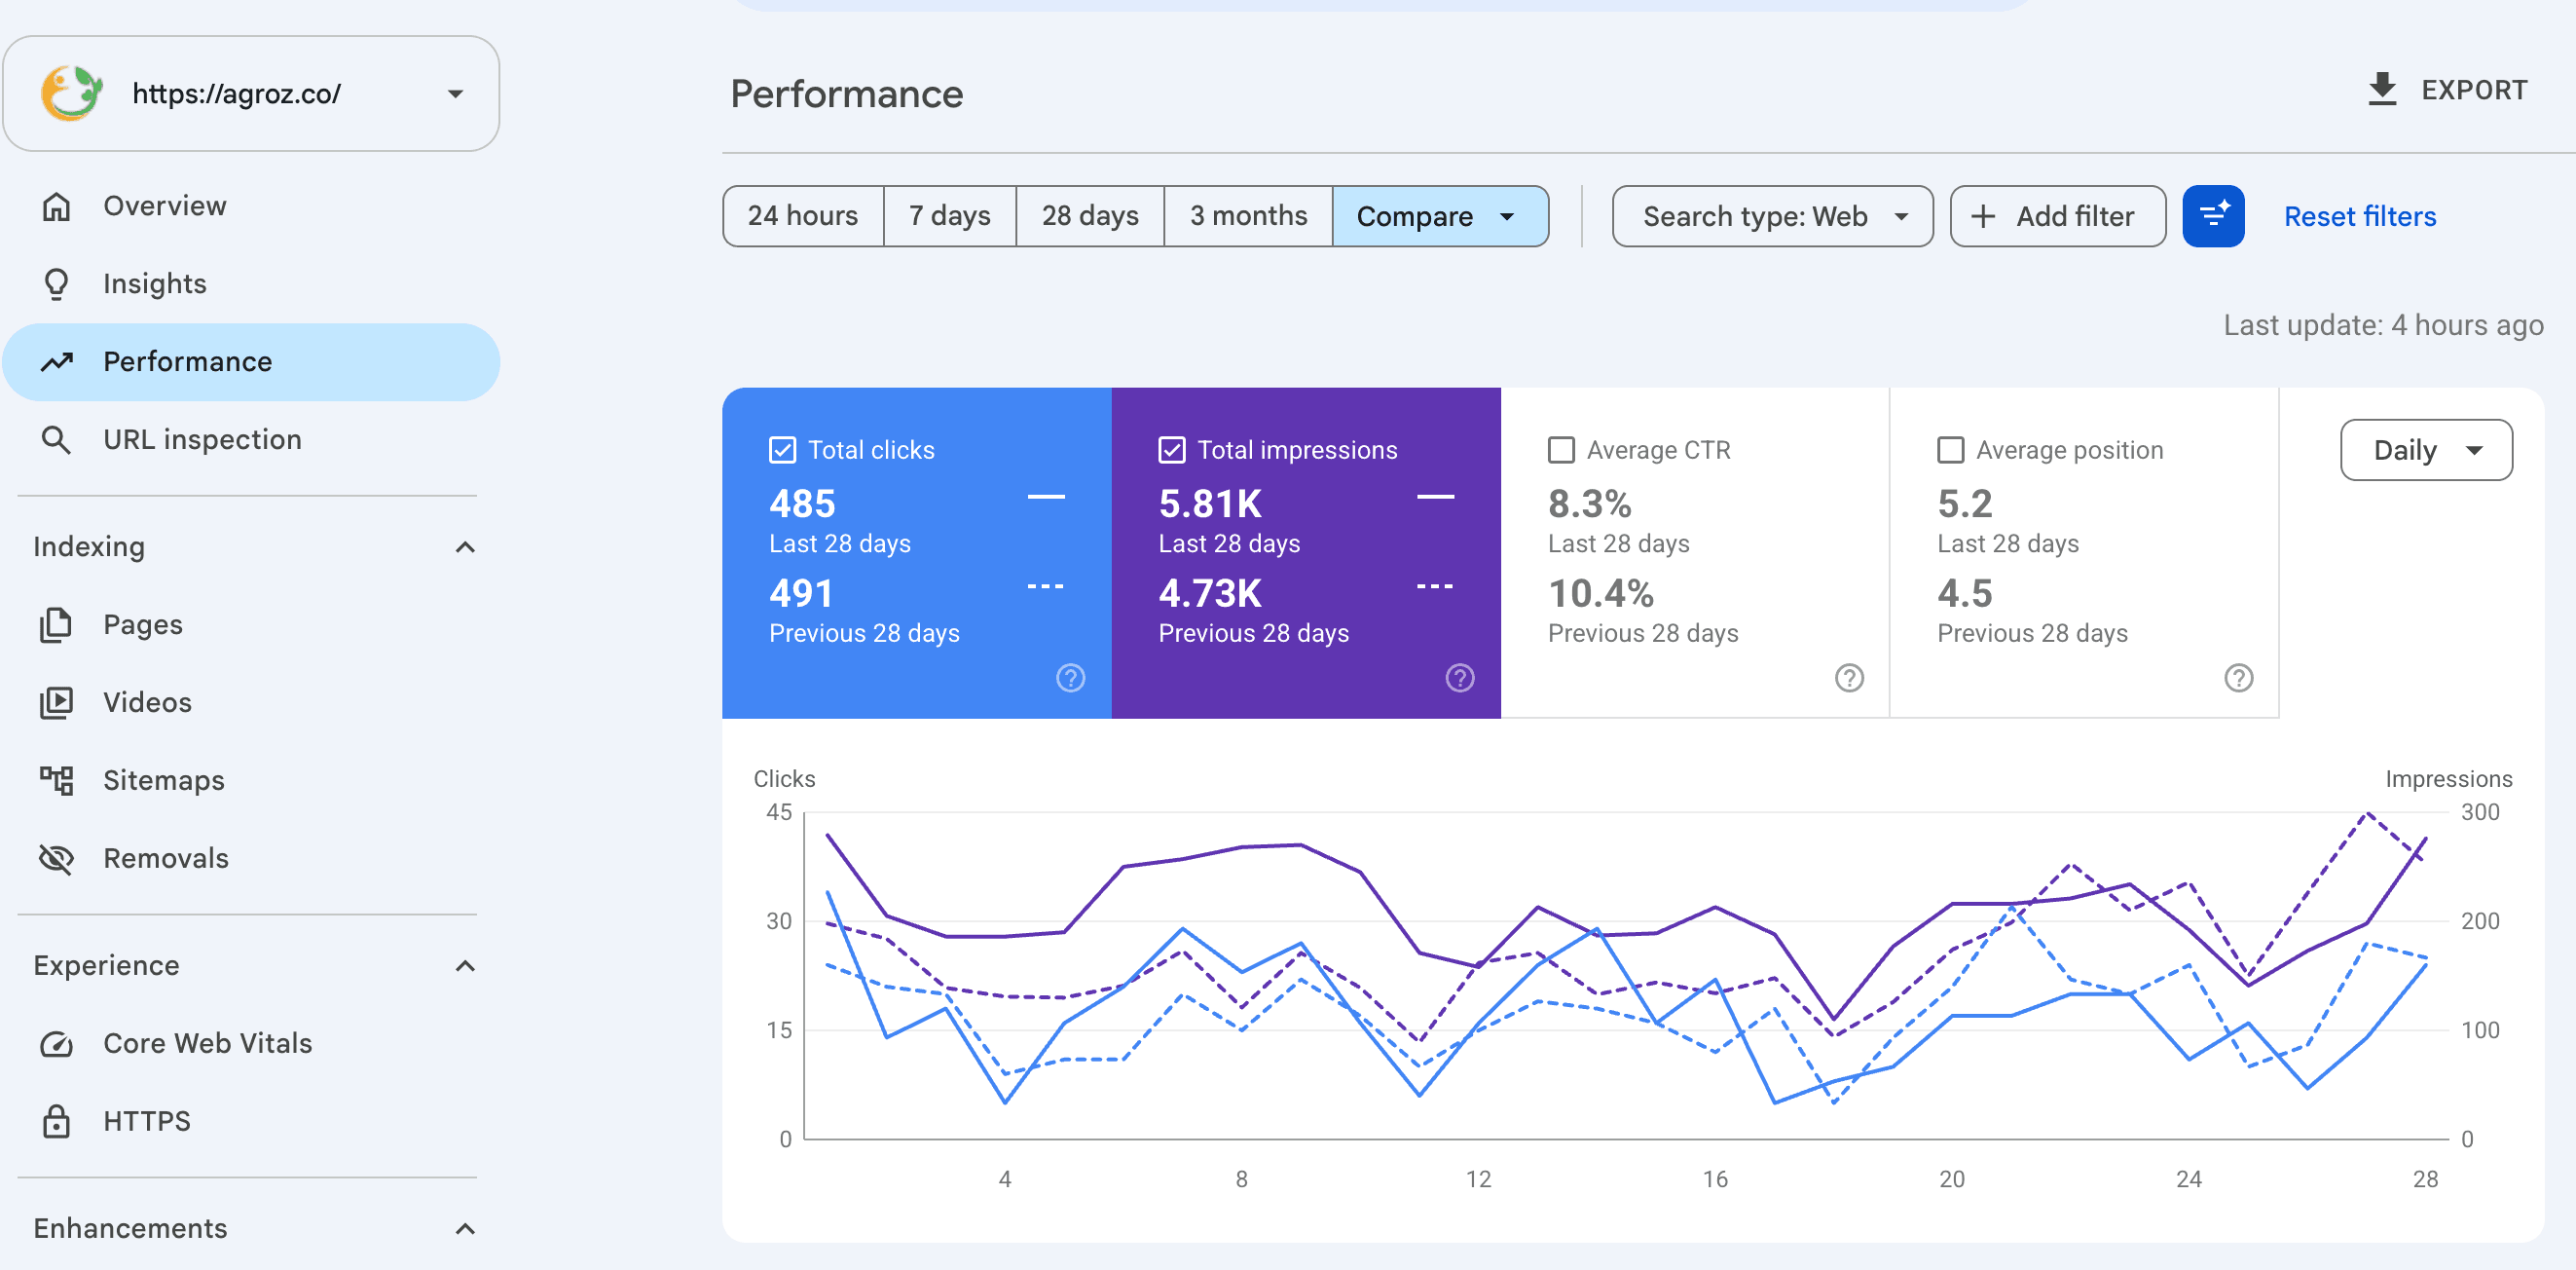
Agroz Google Search Console dashboard.
Live Search Console snapshot

Agroz

5.81K impressions, up from 4.73K

Google Search Console · Last 28 days vs. previous 28 days

Reach expanded while the account held a strong page-one average position in the 5 range.

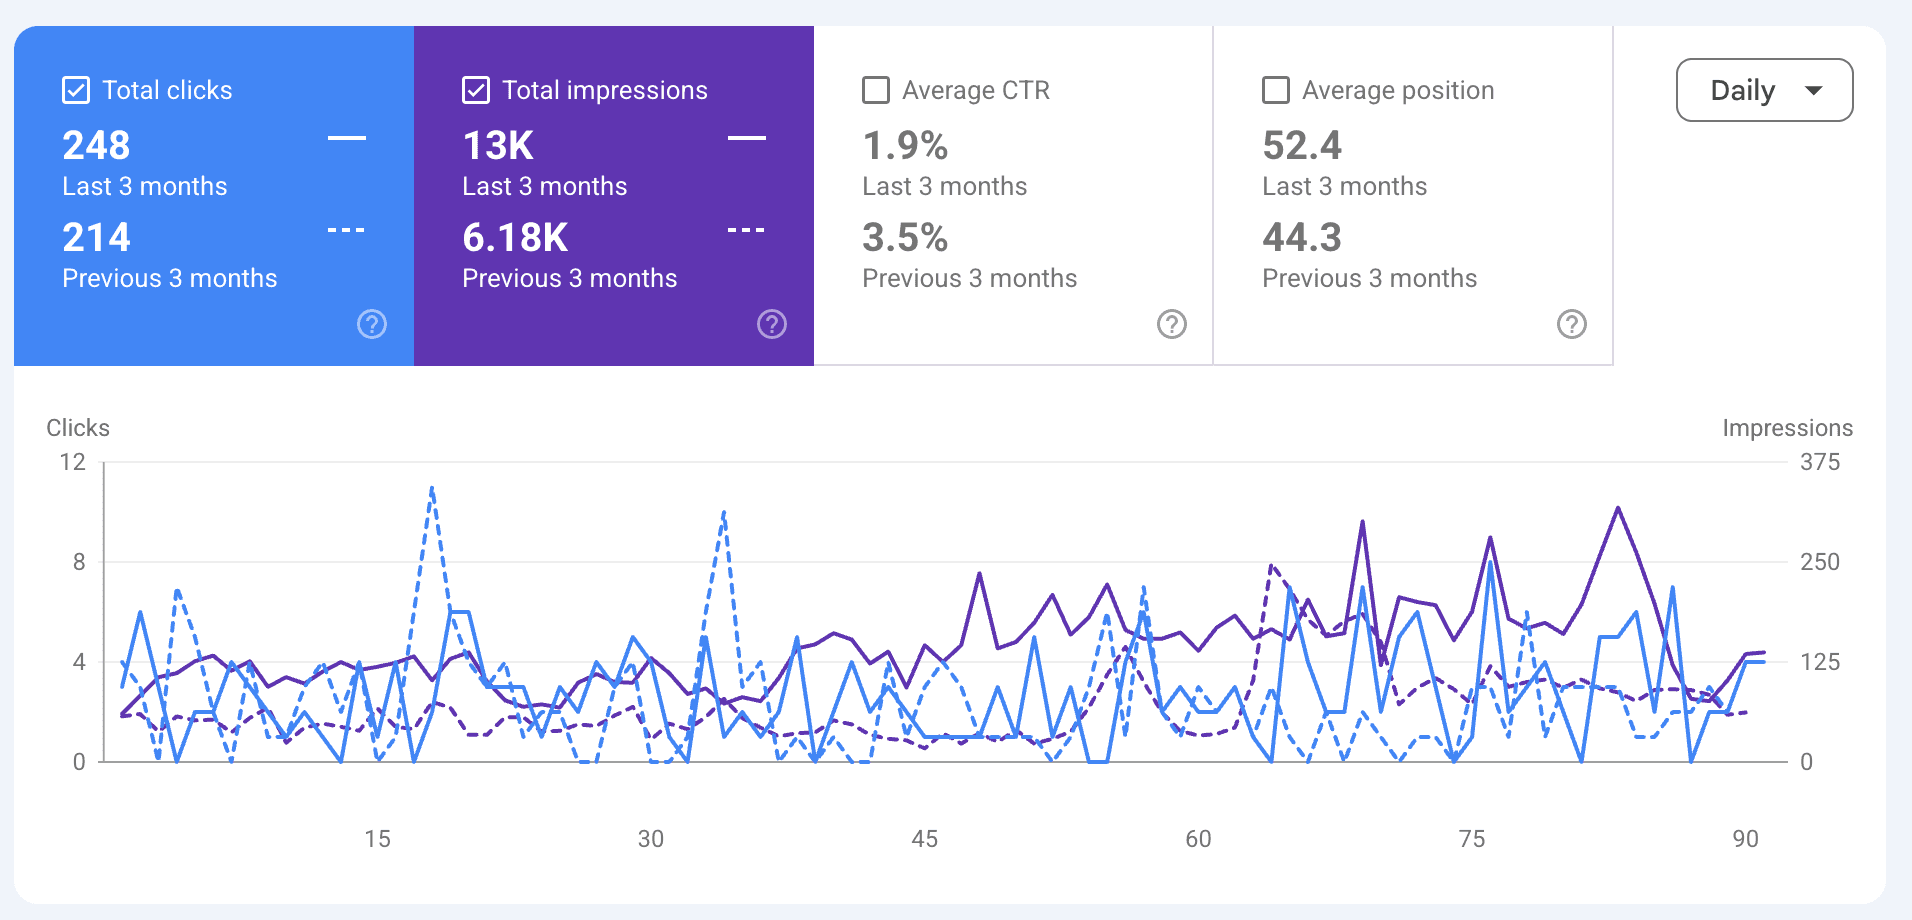
Prouvers Google Search Console dashboard.
Live Search Console snapshot

Prouvers Sdn. Bhd

13K impressions, up from 6.18K

Google Search Console · Last 3 months vs. previous 3 months

Visibility more than doubled as new queries appeared; average position and CTR are presented honestly as still developing.

Ready to build visibility that compounds?

Explore our link-building packages or talk to us about a campaign built around your market and goals.

Explore SEO packages